Wfreport
From Wiki of WFilter NG Firewall
(Difference between revisions)
| (6 intermediate revisions by one user not shown) | |||
| Line 1: | Line 1: | ||
{{DISPLAYTITLE:Reports}} | {{DISPLAYTITLE:Reports}} | ||
| − | |||
| − | + | The "Reports" module provides statistics and reports for WFilter NGF. Besides the pre-defined reports, you also can customize the reports by yourself. Every report can be scheduled to be emailed. | |
| − | + | ||
| − | "Reports" provides pre-defined | + | |
| − | + | ||
| − | + | ||
| − | + | ||
| − | + | ||
| − | + | ||
| − | + | ||
| − | + | ||
| − | === | + | == Customize a Report == |
| − | + | ||
| − | + | ||
| − | + | ||
| − | + | ||
| − | + | ||
| − | + | ||
| − | + | ||
| − | + | ||
| − | + | ||
| − | + | ||
| − | + | ||
| − | + | ||
| − | + | ||
| − | + | ||
| − | + | For example, suppose you want a report named "Top 50 users of bandwidth consumed in last month", below are the steps: | |
| − | + | ||
| − | + | * Click "New". | |
| − | For | + | * Set "Users" to "All". |
| − | + | * Set "Report Name" to "Top 50 users of bandwidth consumed in last month". | |
| − | + | * Set "Report Type" to "Bandwidth". | |
| − | + | * Choose "Bandwith Report" as the "Report Content". | |
| + | * Set "Date Range" to "Last month". | ||
| + | * Set "By1" to "IP". | ||
| + | * Set "Format" to "Bar". | ||
| + | * Order by "Total" desc. | ||
| + | * Display "Top 50". | ||
| + | * Save. | ||
| + | |||
| + | Now you can query this report, if you want to receive this report via email. You need to schedule this report and set target emails. | ||
| + | |||
| + | [[File:ros_report_01.png|650px]] | ||
| + | |||
| + | |||
| + | * Notice: | ||
| + | * For report email sending, you need to enable "SMTP Server" in "System"->"Email". | ||
| + | * If you scheduled a "everyday" report, this report will be sent on 2:00 AM in next day. | ||
| + | |||
| + | == Report Dashboard == | ||
| + | |||
| + | [[File:report_dashboard.png|1000px]] | ||
| + | |||
| + | == Top 20 visited websites == | ||
| + | |||
| + | [[File:report_top_domains.png|1000px]] | ||
| + | |||
| + | == Top 20 websites of bandwidth consumed == | ||
| + | |||
| + | [[File:report_top_domainbandwidth.png|1000px]] | ||
| + | |||
| + | == Report by hours == | ||
| + | |||
| + | [[File:report_hours.png|1000px]] | ||
| + | |||
| + | == Trends of bandwidth == | ||
| + | |||
| + | [[File:report_bandwidthtrends.png|1000px]] | ||
| + | |||
| + | == Web Surfing Details == | ||
| + | |||
| + | [[File:report_websurfingdetails.png|1000px]] | ||
| + | |||
| + | == Bandwidth Details == | ||
| + | |||
| + | [[File:report_bandwidthdetails.png|1000px]] | ||
| + | |||
| + | |||
| + | == Settings == | ||
| + | |||
| + | [[File:report_settings.png|800px]] | ||
Latest revision as of 17:05, 28 February 2019
The "Reports" module provides statistics and reports for WFilter NGF. Besides the pre-defined reports, you also can customize the reports by yourself. Every report can be scheduled to be emailed.
Contents |
[edit] 1 Customize a Report
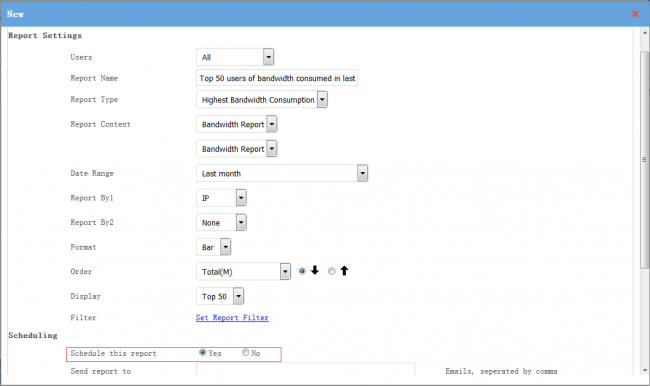
For example, suppose you want a report named "Top 50 users of bandwidth consumed in last month", below are the steps:
- Click "New".
- Set "Users" to "All".
- Set "Report Name" to "Top 50 users of bandwidth consumed in last month".
- Set "Report Type" to "Bandwidth".
- Choose "Bandwith Report" as the "Report Content".
- Set "Date Range" to "Last month".
- Set "By1" to "IP".
- Set "Format" to "Bar".
- Order by "Total" desc.
- Display "Top 50".
- Save.
Now you can query this report, if you want to receive this report via email. You need to schedule this report and set target emails.
- Notice:
* For report email sending, you need to enable "SMTP Server" in "System"->"Email".
* If you scheduled a "everyday" report, this report will be sent on 2:00 AM in next day.
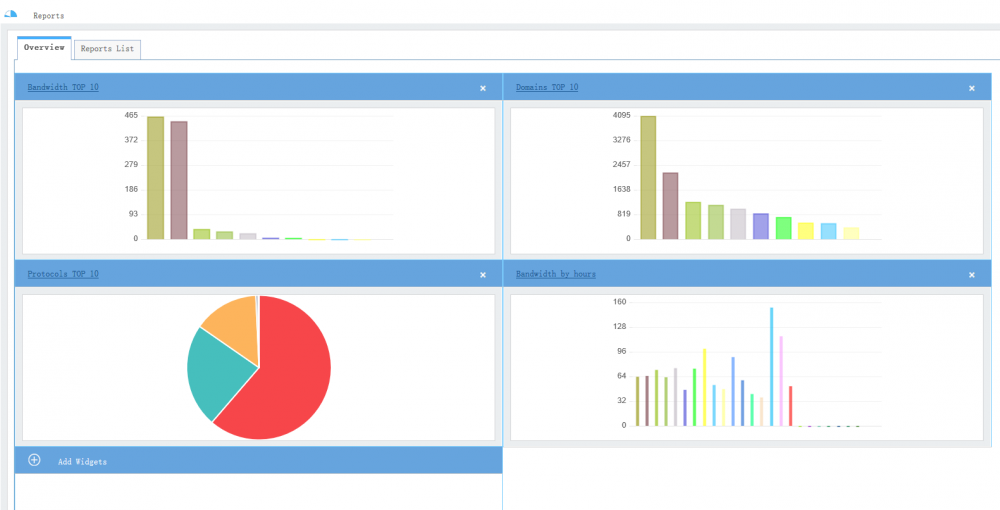
[edit] 2 Report Dashboard
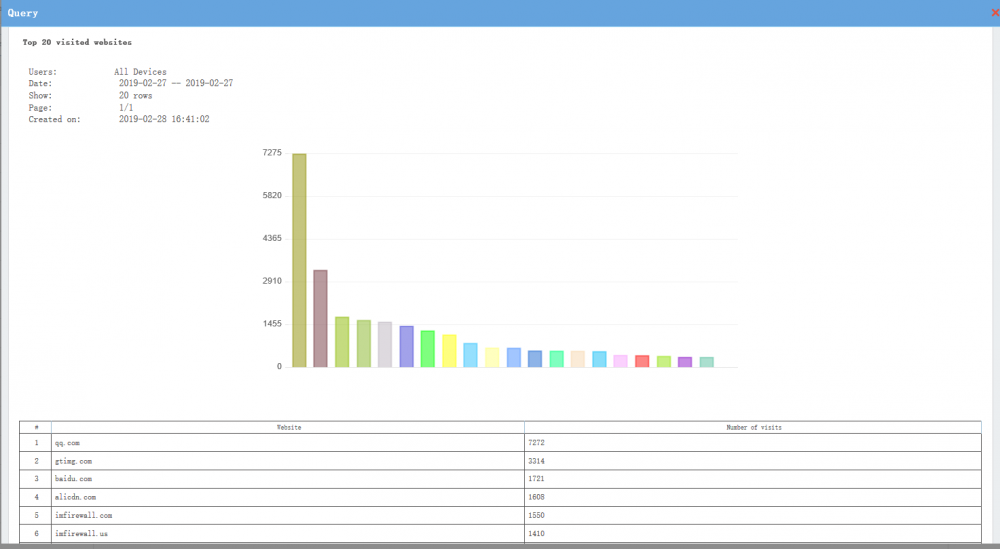
[edit] 3 Top 20 visited websites
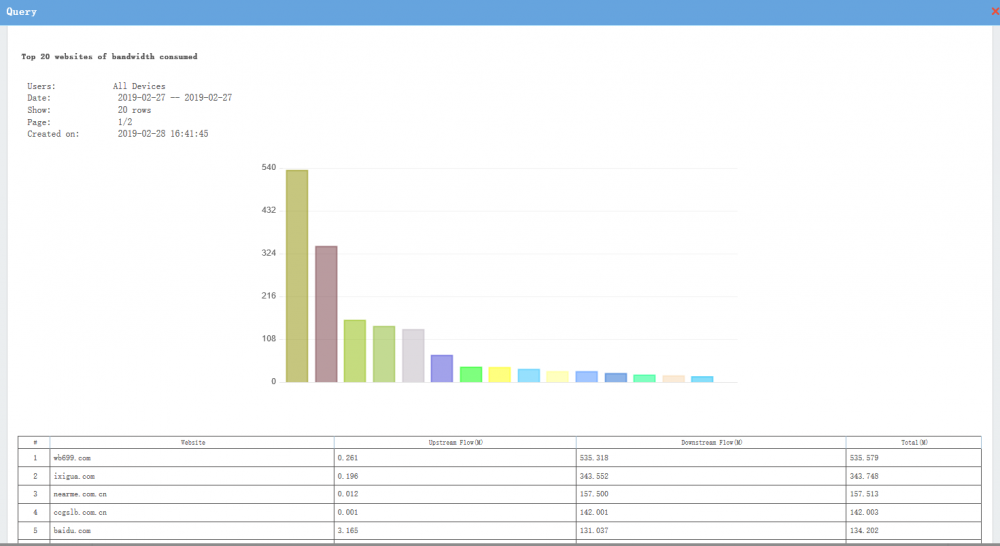
[edit] 4 Top 20 websites of bandwidth consumed
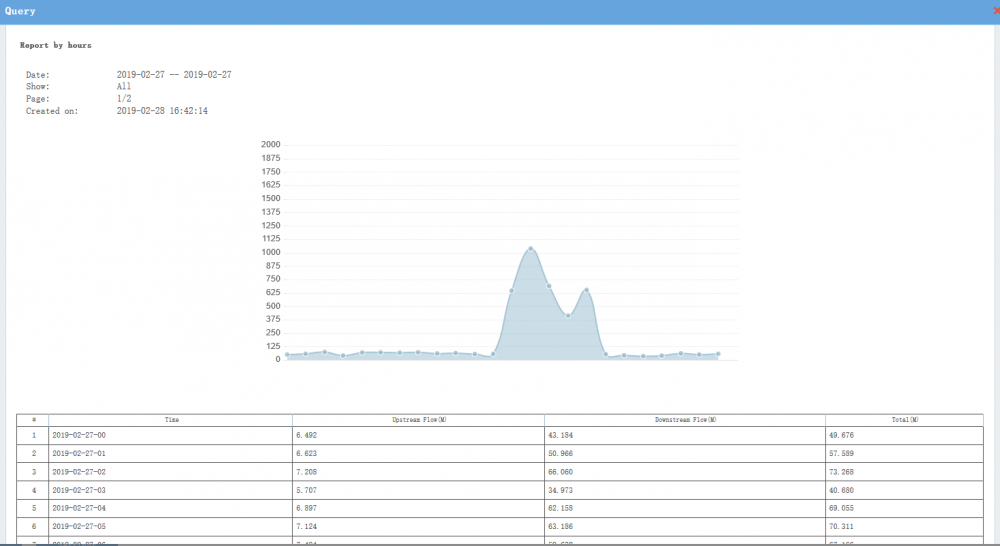
[edit] 5 Report by hours
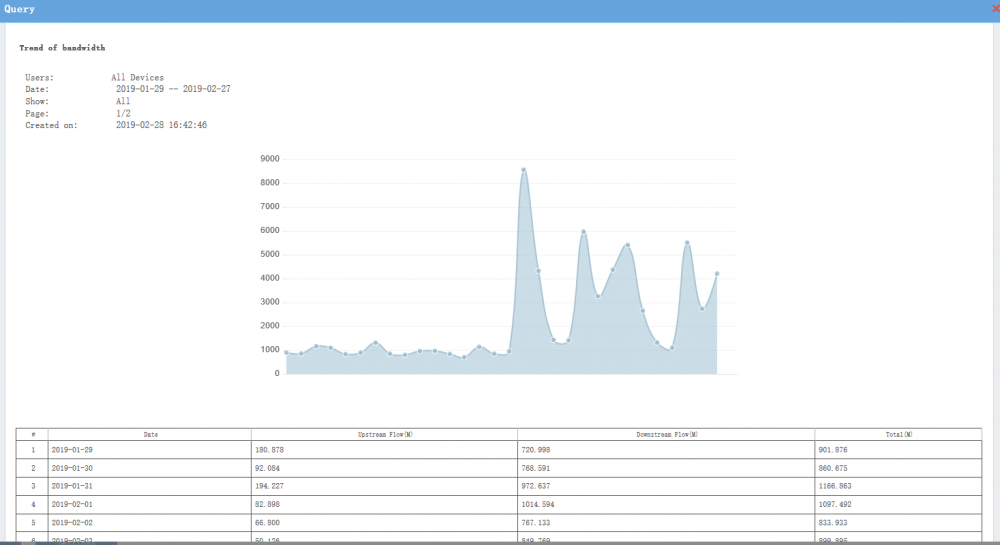
[edit] 6 Trends of bandwidth
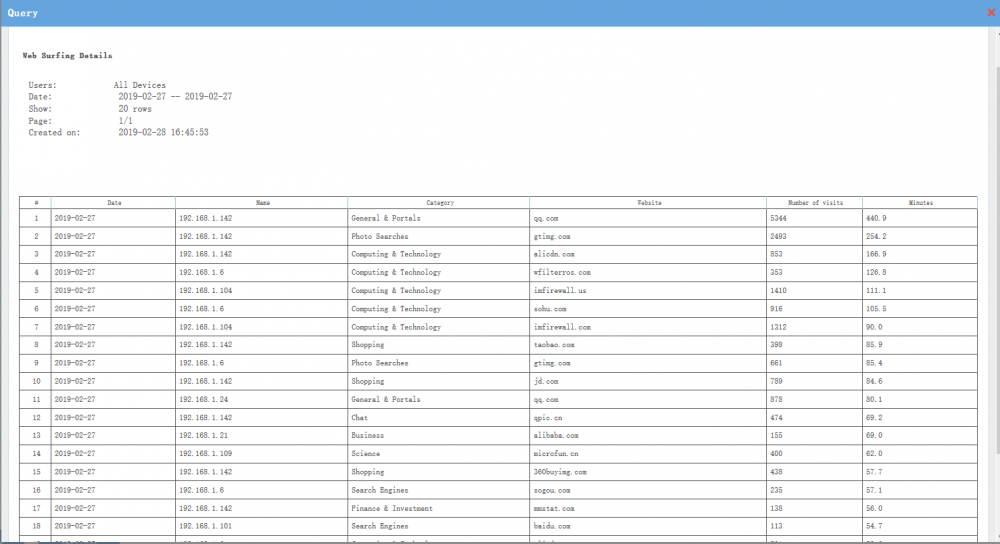
[edit] 7 Web Surfing Details
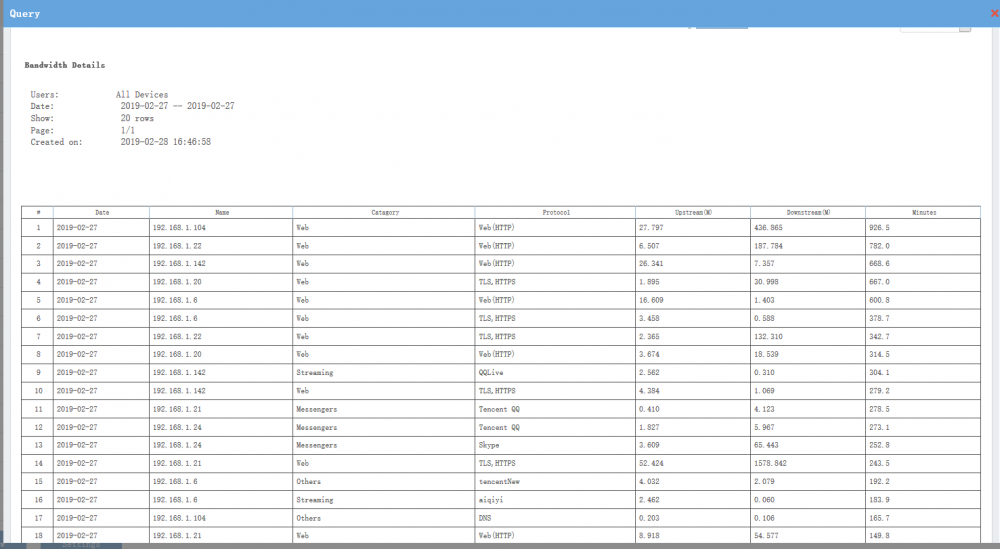
[edit] 8 Bandwidth Details
